AVR Jtag ICE enables AVR based ICs to be debugged using hardware breakpoints.
The JTAG interface is a 4-wire Test Access Port (TAP) controller that is compliant with the IEEE 1149.1 standard. The IEEE standard was developed to enable a standard way to efficiently test circuit board connectivity (Boundary Scan). Atmel AVR devices have extended this functionality to include full Programming and On-chip Debugging support.
The JTAG ICE uses the standard JTAG interface to enable the user to do real-time emulation of the microcontroller while it is running in the target system.
Features[]
- AVR Studio ver-4 and IAR Embedded WorkBench Compatible
- Supports AVR Devices with JTAG Interface(see the supported devices session for compatibility)
- Break on Change of Program Flow
- Data and Program Memory Breakpoints
- Supports Assembler and HLL Source Level Debugging
- USB Interface to PC for Programming and Control
Supporting Devices[]
- ATmega128
- ATmega128L
- ATmega16
- ATmega162
- ATmega162V
- ATmega165
- ATmega165V
- ATmega169
- ATmega169V
- ATmega16L
- ATmega32
- ATmega323
- ATmega323L
- ATmega32L
- ATmega64
- ATmega64L
PinOut and connection details[]
How to connect?[]
Connect the JTAGICE to the PC using Mini USB cable. When the USB is connected to the JTAGICE board, the Power LED will glow indicating the presence of power. At the same time, a Busy LED will blink with a delay of 100ms for approximately 5 seconds and then turned off.That means the JTAGICE is ready to be used.
Check the driver status at My Computer -> RightClick -> Manage and open the Device Manager. The device uses CP2102 device driver. In case the driver installation is not successful download the latest driver from the Silicon Labz official website.
The steps required for knowing the correct Serial Port number.
In the Device manager - Expand Ports(COM & LPT) as shown below
Working with AVR Studio 4[]
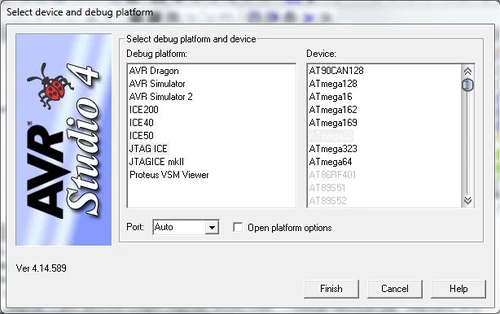
Selecting debug device This section describes how to select the Debug device in AVR-Studio 4 for making it possible to debug the target ICs.
Click Debug menu -> select Select Platform and Device option from the drop-down menu -> change the Debug Platform to JTAGICE -> Select Device.
After selecting the JTAGICE Debug device, the user needs to select the correct communication port for connecting to the target. After connecting JTAG to the target, use the following method for establishing the target connectivity.
Click Tools menu -> select Program AVR option from the drop-down menu -> select Connect -> Under Platform select JTAGICE -> Under Port change the com port number to the number shown earlier in the Device Manager -> click Connect.
If the connection is a success, you will be presented with the following figure. Fuse bit settings may be changed to fit the oscillator frequency.
Remarks: Please refer the datasheet before playing with the fuse bits. Wrong configuration can make your device bricked forever.
Click Tools menu -> select Start Debugging option from the dropdown menu to burn your code and start the debug section.
Working with IAR Embedded WorkBench[]
This section describes how to select the Debug device in IAR Embedded WorkBench for making it possible to debug the target ICs.
After creating your project and compiling the code, right-click your project name and select Options from the Workspace Dialog Box. Optionally you can click Project menu -> select Options.
Under category list select Debugger. Under Setup change the driver to JTAGICE as shown below
Click Project menu -> select Download and Debug option from the drop-down menu to burn your code and start the debug section.


